GVSU Destination Report
I just finished up a bit of a fun site at work: https://www.gvsu.edu/destination. It’s the first time GVSU has built a dedicated web version of this report. Since a lot of the work I have been doing lately has been heavily into back-end application development, it was nice to get a break and make something where I could focus more on the design.
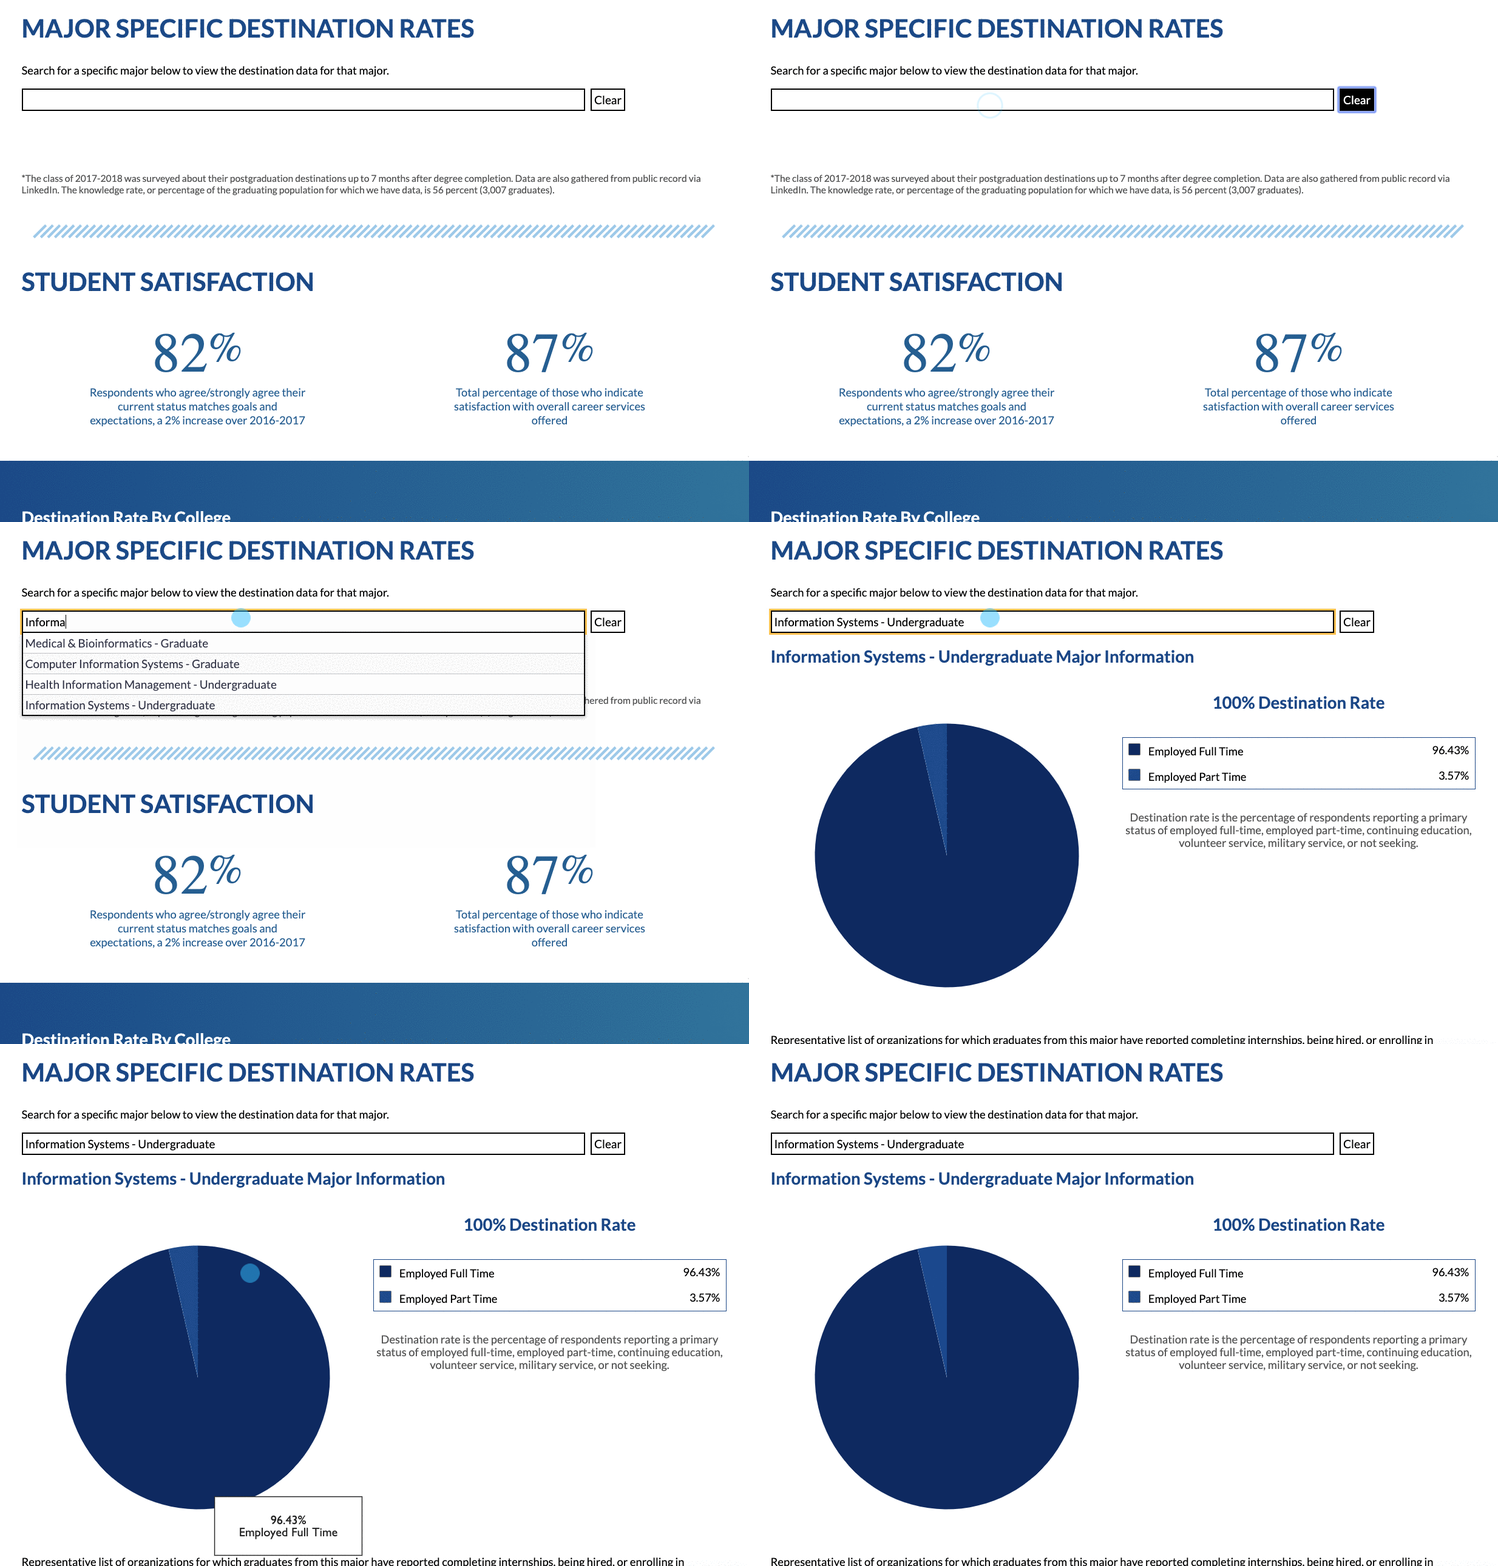
I also got to create an interactive React component to look up major-specific data about degrees. This was cool both because it makes it easier for students and potential students to see what they can do with a degree, and I also got to use Victory Charts, a React graphing library I had been wanting to play with. It turned out pretty nice, easy to use and make accessible:

It proved a little tricky to integrate into the rest of the site. Mostly because I set it up using create-react-app and really didn’t want to eject it out of that. I ended up creating it as a sort of sub-project whose base HTML file then gets included in the larger project via the back end language. It worked really well, I would definitely use this method if you come across a similar situation.
